
When we break it down, CE is calculated by dividing pounds of components by dry matter intake and multiplying that by 100. It gives the producer a gauge of how efficiently the cow is converting feed and forage to pounds of milkfat and protein. This efficiency measurement is more closely aligned to what impacts the milk check in many herds in the U.S. It's simple to measure but extremely powerful when you understand how it is calculated and then consciously manage.
Why it matters
If your pay price is based on pounds of fat and protein shipped, then CE is one of the best ways to measure profitability. Components are what processors are paying for, because milkfat and protein are what is used to produce the majority of retail dairy products.
If you can yield more components while feeding less, your income over feed costs will be positivity impacted. Since greater than 80% of milk’s value is derived from the pounds of fat and protein, economic return from improvement in component efficiency can be significant.
What is possible
Being above 11% for CE is a realistic goal. Our company performed an observational study and collected management information from 21 high-producing herds in the upper Midwest, ranging between 56 and 1,656 cows. These herds were chosen because they had consistently produced 6 pounds of components or more for over a year. In addition, the fermentable carbohydrate and protein pools, as well as physical effectiveness of neutral detergent fiber (peNDF) within their rations, was also evaluated.
The herds were categorized into three groups based on their average pounds of components, 7+, 6.5 to 7 and below 6.5. From the data CE, feed efficiency and milk production data was reviewed.
What we learned:
1. High components does not equal high CE. Dry matter intake (DMI) was the first thing we observed. The herds averaged around 60 pounds of DMI. As you might suspect, dairies that produced more energy-corrected milk (ECM) had a slightly higher DMI than ones that produced less. However, outliers are where we found the most room for improvement. One of the highest component herds managed 7 pounds while feeding 70 pounds of dry matter, a 10% CE. There’s room for at least a 1% improvement – can we get the same number of components with less feed?
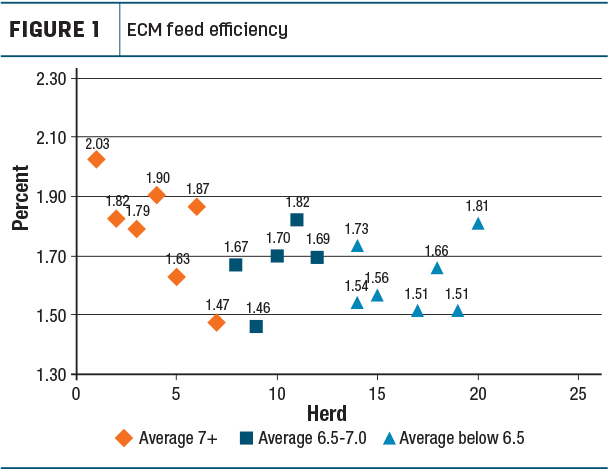
2. There’s room for improved feed efficiency. After plotting each herd’s feed efficiency based on ECM, it was clear that the herds falling into our highest category (7+) were distributed all along the y-axis (Figure 1). Energy-corrected milk feed efficiency among the three groups ranged from 1.62 to 1.79 and averaged 1.69.
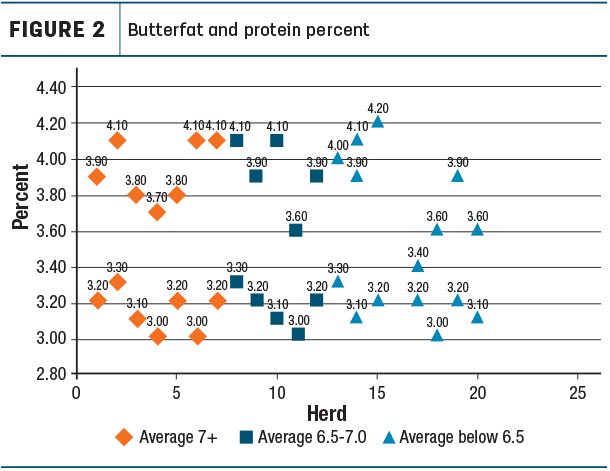
3. We have the genetics for butterfat and protein. On the other hand, the difference in butterfat and protein production between the three groups was a much smaller range (Figure 2). Among the herds, butterfat averaged a 3.89 and ranged from 3.8 to 3.93. Protein averaged 3.15 and ranged from 3.14 to 3.16.
It all starts with excellent rumen health and maximizing microbial protein. Only half the farms were feeding a protected methionine source, while the other half reached these numbers through solid nutrition and rumen health. Today’s Holstein cattle have the genetic potential to produce well above 3.8% butterfat and a 3% protein. Additionally, these numbers can be influenced another 0.10% by using supplements and additives, if and only if it is economically feasible.
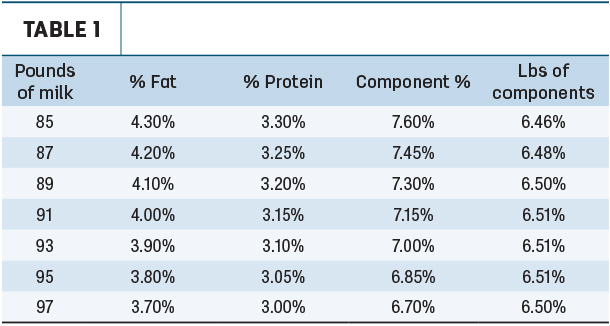
4. Milk production drives pounds of components. It is not all about components. Production also plays a critical role in the numerator of the CE equation. If you want 7 pounds of components, you need to be at 100 pounds of milk with 3.9% fat and 3.1% protein. Simple math clearly indicates there is a 2-pound rule when evaluating milk production versus components. For every 2 pounds more or less milk, you can gain or lose 0.10% in fat and 0.05% in protein production per cow (Table 1).
5. Evaluate what is realistic for your herd. First, start with your expectations. People throughout your organization perform to expectations. If expectations are low, performance will be low. Set and demand high performance.
Second, look for low-hanging opportunities. I would recommend assessing your fat-to-protein inversions versus days in milk (DIM) on test day. (If protein tests higher than milkfat, an inversion has occurred. For example, 3.0% protein and 2.9% fat is inverted.) You may regularly find a lactation group or a timeframe where fat-to-protein inversions occur. These cows are not performing to potential. We are finding that it is reasonable to expect less than 10% fat-to-protein inversions across lactation groups and DIM. As we creep above this level, cow health is at risk and opportunity is lost.
Getting more components
In the last twenty years, we have gained insights and understanding of the balance and interaction of ingredients that ultimately make up the nutrient pool within the rumen. Impacts, whether intentional or not, affect rumen and cow heath as well as component efficiency.
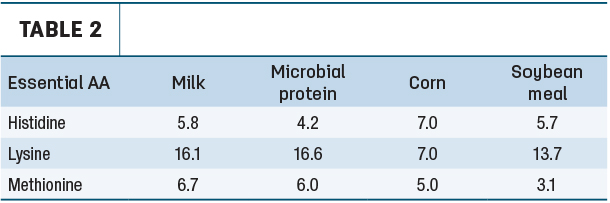
Maintaining rumen function is important for sustaining solid components. Microbial proteins feed the pig behind the rumen. As shown in Table 2, microbial protein has the closest blend to milk protein compared to other common ingredients such as corn and soybean meal. When we balance for amino acids, we are attempting to bridge the gap between what the rumen can produce and what our ingredients can supply.
Nutrients that enter the rumen can only leave one of two ways, digested or passed. Rumen degradation (RD) is equal to rate of digestion (Kd) divided by Kd plus the rate of passage (Kp) or RD = Kd/(Kd+Kp). What is crucial is controlling the Kp, rate of passage, of nutrients. If nutrients are passing too quickly, the cow cannot fully degrade the nutrients supplied, but if they are in the rumen too long, then they become useless to the rumen microflora and reduce microbial protein production.
Rate of passage (Kp) is a critical driver in the RD formula, which pushes DMI. This needs to be controlled if we are to optimize component efficiency. Focus on fiber first. Physical effective neutral detergent fiber (peNDF) is one of the key fractions of NDF. It stimulates chewing and contributes to the floating mat of large particles in the rumen and impacts Kp. One of the primary characteristics of peNDF is particle size of feeds and forages. Using the Penn State Particle Separator and looking at the amount of NDF on the top three screens will tell you the amount of peNDF. This will also determine if the ration you have written down on paper is the one being delivered to the cow.
Next up are fatty acid profiles of feed ingredients. Fat plays a role in overall metabolism, metabolic health and reproduction, as well as being a determent in milkfat production. Be aware, the type of fat is important. Rumen microbes dislike unsaturated fats. If unsaturated fats leave the rumen without synthesis, they can have a direct effect on the mammary glands to suppress milkfat.
Last on the list is starch. If overfed, it lowers rumen pH and may alter rumen functions. It is frequently the first lever pulled when cows are not performing to expectations. Often there is a short-term response, and just as often it is not sustainable. More starch may not be the simple answer to drive performance and can lead to decrease components.
What it all comes down to is balance. It’s called a “balanced ration” for a reason. Testing forages, feeds and milk; reviewing feeding protocols; and listening to what the cow is telling you, as well as utilizing the valuable rumen insights we have, goes a long way for milk production and component efficiency. Looking to the future, I believe upcoming research on rumen neutral detergent fiber 240 (ruNDF240), as well as physical effective neutral detergent fiber 240 (peNDF240), will give us an even better understanding of rumen function. ![]()
PHOTO: Staff photo.

-
Hank Spencer
- Dairy Specialist
- Cargill
- Email Hank Spencer