Optimum forage quality is critical with grain, commodity and forage prices at historic highs. Relative feed value (RFV) was a ranking tool useful in the past. It incorporates ADF and NDF to estimate intake and digestion.
Relative forage quality (RFQ) is of greater utility to value hay crop forages today. It incorporates additional nutrient analyses including a measure of vitro digestibility. Fiber digestibility differs within a forage species, largely related to the amount of lignin in the neutral detergent fiber (NDF).
Also, legumes and grasses are digested differently due to cellulose, hemicellulose and lignin levels and bonds. Undersander and Moore describe the calculation differences in detail and the advantages of RFQ.
Legumes typically have a faster speed of digestion but higher indigestible lignin bound to NDF (reported as lignin, percentage of NDF). Grasses are lower in lignin, percentage of NDF, but can be more slowly digested, especially if harvest is delayed.
In the past legumes may have been preferred for higher milk production, but newer grass, small- grain forage and BMR sorghum/sudan varieties and earlier harvesting make grasses and legume/grass mixtures more attractive. Double-cropping winter and summer annual grasses has gained popularity and can fit nutrient management plans and crop rotations nicely.
RFQ improves on the RFV concept by including more nutrients and newer digestibility measures. NDF (fiber) digestibility, percentage of NDF (NDFD) is routinely run at commercial labs by digesting the dried/ground forage with rumen fluid for a specific number of hours.
NDFD and other lab results are incorporated into energy calculations in RFQ. It’s important to know that while CP, ADF and NDF procedures are reasonably standardized, lab NDFD procedures can vary somewhat, yielding different results between labs.
Also, different digestion time points are available. Many labs participate in quality control programs such as the NIR Consortium and National Forage Testing Association (NFTA); NDFD is not yet monitored.
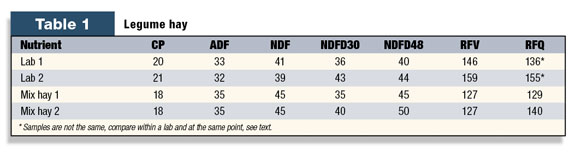
Table 1 gives 2010 averages for legume hay from two large commercial labs. Both are reputable and participate in quality assurance programs. The samples tested are not the same and the point is not to pick which lab is “better.”
The point is that, for consistency of evaluation, you must compare within a lab and time point. Also, note two mixed hays with the same CP, ADF and NDF, but different NDFD values have different RFQ numbers, reflecting the higher digestibility of hay #2.
Grasses are more fairly ranked with RFQ. Legumes with the same RFV that have lower digestibility are ranked lower with RFQ. Corn silage is not ranked with RFQ/RFV.
RFQ and RFV are not used by nutritionists in ration formulation. They are useful for ranking forages for animal feeding allocation (higher-value RFQ fed to higher-requirement animals) and for pricing from a common basis.
Our consultants have a spreadsheet that compares the value of a haycrop on its RFQ/RFV number, and moisture/DM percentage. From a survey of recent auction prices for dairy-quality hay (RFQ/RFV=150), we determine the value per RFQ/RFV point at 90 percent DM.
Then we calculate the value of the haycrop being compared based on its tested RFQ/RFV and DM percentage.
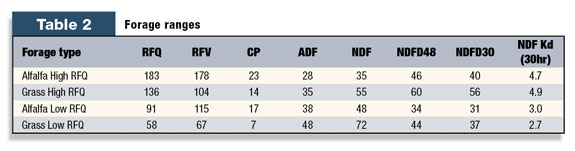
Table 2 provides the values for alfalfa and grass that are approximately 1/3 higher and 1/3 lower than averages from 2010 results. There are analyses above and below these, but 2/3 of samples fall within these ranges and these results are commonly seen. We’ll compare the effect of using these forages on IOFC in rations.
We formulate rations in CPM (or other modern software) for Metabolizable Energy (ME) and Metabolizable Protein (MP) allowable milk and potential income over feed cost (IOFC). Modern ration software, using NDFD and/or lignin, calculates the amount of fiber available to be digested (pool size).
Using NDFD analysis and a Cornell equation provides an estimate of how fast that fiber is digested (Kd). When calculating Kd, a shorter NDFD time point is more representative of digestion in high-producing cows.
With this information and a calculation of how long the fiber will remain in the rumen (Kp) based on cow intake, we calculate the supply of energy and protein from the forages fed.
Higher digestibility forages, in addition to providing more energy, allow greater numbers of rumen microbes to grow more efficiently. Rumen microbes are high in protein and all of that is “bypass” with an amino acid profile similar to that in milk.
This is called microbial MP and contributes greatly to total MP required. For the same level of milk production, more microbial “bypass” protein reduces the need/cost of supplemental “bypass” protein.
Lower energy supplementation (from starch, sugar and soluble fiber – at increasing prices) is needed if the NDF is more digestible. Alternatively, feeding the same grain amounts would boost production at higher forage NDFD. An additional bonus with higher NDFD is higher total DM intakes.
Classic work by Oba and Allen showed each 1 percent increase in NDFD can result in up to ½ lb more DM intake. That’s not figured into the example rations below. Lower costs and higher production both increase IOFC. Higher production is often the more profitable option.
Several example rations illustrate this. Assumptions are: 15# of haylage DM (40 to 50 percent of forage) would be fed regardless of quality (to “use it up”), corn silage (CS) is available to replace grain (CS always is the best cost option); rations were balanced for 85# of 3.8 BF percent and 3.15 percent TP with Eastern prices; forage prices were the same (delayed harvest shouldn’t change price much) and a $20 per hundredweight (cwt) milk price.
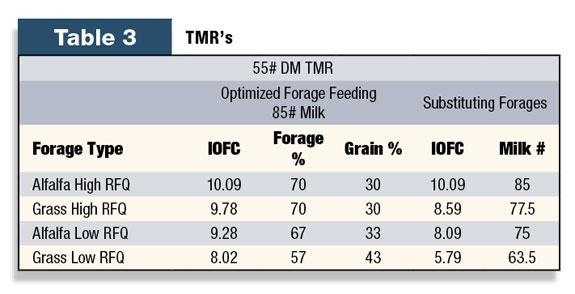
Table 3 shows TMRs optimized with differing forage quality, the amount of grain required to maintain 85#’s of milk and the IOFC. The low-quality haylage likely would not be used for high producers, but rather for low cows/heifers.
It’s a dramatic illustration of the effect of NDFD/RFQ. Also shown is the effect of keeping the same amount of haylage and CS and substituting the lower RFQ forages for the highest quality.
A challenge of the Alf Hi RFQ diet is the elevated CP (>18 percent) and high-soluble protein, resulting in up to five units higher MUN and excess N excretion. Another caution with high RFQ/NDFD forages is the potential for lower “chewing effect.”
An adjustment to the physically effective NDF can be made. We find a combination of legume and late- maturing grass/small-grain forage varieties harvested when the mix is at optimum maturity can be the best combination with high-digestibility (BMR) corn silage.
The benefit of forage quality for higher IOFC is clear. High vs. low alfalfa RFQ in the example would return almost $300,000 per year on 1,000 cows. You can use higher forage levels, lower costs and maintain the same production.
You cannot rebalance for the same IOFC with lower-quality forage. If forage quality changes and rations are not rebalanced (unlikely), the effect on IOFC is even more dramatic. High-quality forage, defined as highly digestible fiber (NDFD and RFQ) results in highest IOFC, especially as the grain/commodity prices remain high. PD
References omitted due to space but are available upon request to editor@progressivedairy.com .
Photo courtesy of ThinkStock.com .

-
Tim Snyder
- Nutrition Manager
- Renaissance Nutrition Inc.
- Email Tim Snyder