There are several dairy feeding programs being utilized by dairies around the world. Some of the more popular include EZ Feed, Feedwatch, TMR Tracker and One Feed. Regardless of which program a dairy uses, the important thing is to be able to get concise usable information from it to help manage the biggest dairy expense and cornerstone to milk production level: feed.

There are several reports in these programs that can be used to monitor and enhance the accuracy of the feeding program and feeder performance. As with most computer software programs, these feed programs have the power to pull out incredible amounts of data and information, and typically only a fraction of the information available is utilized by the user. In this article, I would like to summarize a few of the more valuable reports and how they can be used to improve the accuracy and consistency of the feeding program.
One of the biggest factors affecting dairy profitability is feed efficiency. Pounds of milk produced per pound of dry matter intake (DMI). The key numbers needed to generate an accurate feed efficiency number are average pounds of energy-corrected milk and average DMI per cow. All feed programs can provide an average of the daily dry matter fed per cow. What can cause feed efficiency calculation issues on some dairies is that the pushout or orts are not accurately recorded.
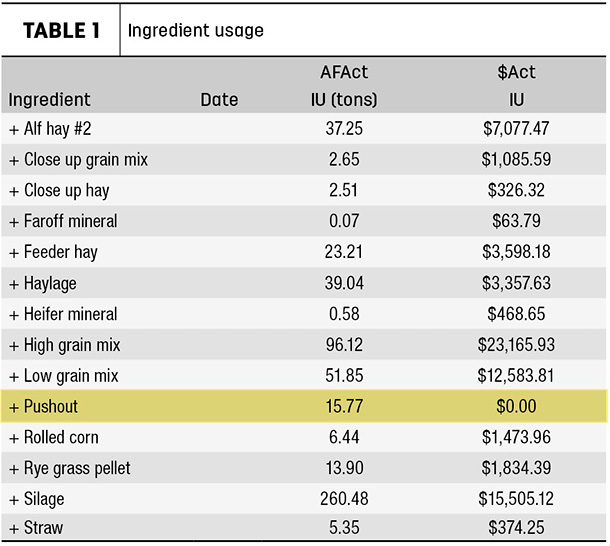
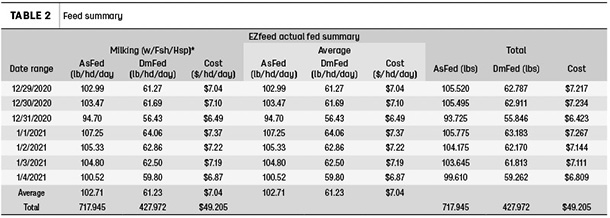
The programs can be utilized to record feed refusal for each individual pen, or the total refusal can be averaged across all pens in some programs. However, some dairies do not utilize the refusal recording part of the feed programs. On those dairies, we have found that putting in the pushed-out feed as an ingredient in heifer or dry cow (Table 1) rations will allow us to determine what the amount of refusal was by looking at the amount of pushout used per week. The Actual Feed Summary reports the pounds of feed fed (Table 2).
These two reports allow you to determine the pushout; dry matter can then be deducted from the total DMI fed to determine the cows’ actual DMI. These reports can also be used to determine how much the dairy is overfeeding cows. Most herds shoot for a pushout percentage of 1% to 4%.
Pushout and DMI calculations
Percent feed refusal calculation:
102.71 pounds per day* x 1,000 cows x 7 = 359.49 tons total pounds fed
15.77 tons pushout fed** x to heifers/dry cows/359.49 = 4.39%
*From Actual Fed Summary
**From Weekly Ingredient Usage Report
Actual DMI calculation:
359.49 tons total feed - 15.77 tons pushout = 343.72/7 = 49.1 daily tons consumed
49.1 tons x 2,000 /1,000 cows = 98.2 pounds consumed per cow
98.2 pounds consumed x 59.6% dry matter = 58.5 pounds of DM per cow
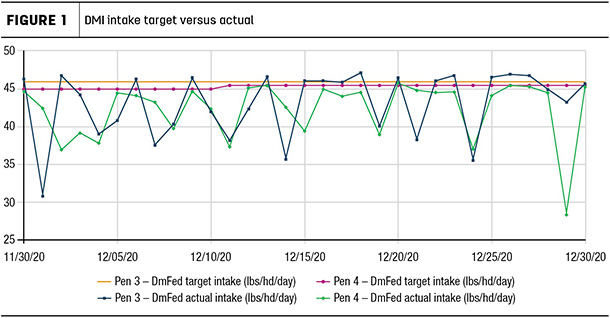
Another report that monitors the consistency of how cows are fed is the variation in bunk call changes or changes in target dry matter fed per pen (Figure 1). This is a good report to understand how much feed delivery is varying from day to day. It also provides insight into how much day-to-day dry matter deliveries vary. In some cases, we have seen the feed manager make large swings in the day-to-day feed deliveries – overdelivering feed one day and then cutting the cows back drastically to make them clean up the overfeeding from the day before. This can become a vicious cycle that leads to dramatic swings in feed availability and DMI, creating an unhealthy situation for cows. When we work with feeders, we educate them to make small day-to-day changes of 1 to 2 pounds of dry matter. Unless cows are mixed up or there is an extreme weather event, small dry matter delivery adjustments should be all that is warranted.
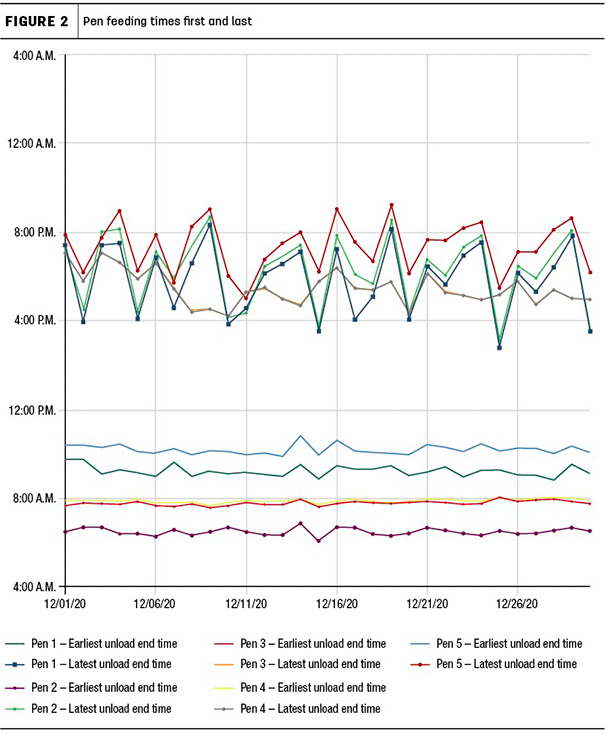
Looking at daily feed delivery times by pen can also reveal the consistency of when feed is delivered to cows (Figure 2). Reports that look at feeding times for first and last loads can show how delivery times vary. Most high-producing herds are delivering feed in the same 10-minute window every day. Often these feed deliveries coincide with cows exiting the parlor; the timing is important so cows will have fresh feed waiting when they return. Extreme variations in feeding times can indicate an unorganized feeding program, equipment breakdowns or ingredient shortages.
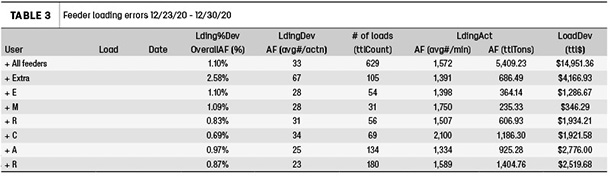
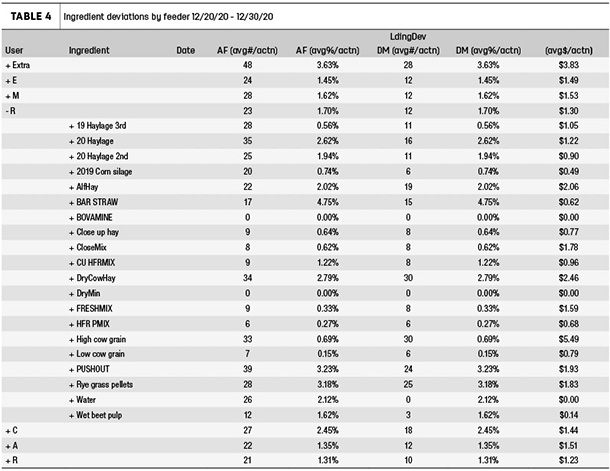
Feeder error reports are helpful in determining how accurately rations are being mixed. Many dairies will pay a bonus on accuracy, which is money well spent. Most feeders can achieve ingredient errors in the 1% to 2% range. Some producers like to look at pounds rather than percentage and shoot for accuracy per ingredient to be within 40 to 50 pounds of the amount called for (Table 3). The report can be designed to generate both numbers, depending on which one the producer prefers. Looking at ingredient errors by feeder (Table 4) can help individual feeders determine which ingredients they are struggling with the most. By knowing those ingredients, feeders can more carefully load those ingredients to lower their error percentage. Typically, some of the highest-error ingredients are straw, feeder/dry cow hay, wet beet pulp and wet distillers. These feeder and ingredient error reports can be printed out and distributed to feeders during weekly or monthly feeder meetings as discussion points.
Some programs also have reports that will show early loading alerts. These reports show when a feeder takes a shortcut by not returning the extra amount of an ingredient to its commodity bay. Instead, they advance to the next ingredient and dump the remainder of the ingredient in the bucket into the mix. This saves them time but results in inaccurate grain mixes and TMRs.
The software can be programmed to detect when an ingredient is loaded too quickly following the previous ingredient, flagging it for review. This can be a common occurrence on dairies, especially those where feeders feel they do not have enough time to get everything done. This can sometimes indicate inefficient feeding schedules, pen feeding order issues or something else that creates a situation in which feeders must rush to meet expectations.
These are a few examples of useful reports that feed software programs can generate to evaluate accuracy and consistency of feed delivered to cows. There are numerous other reports, such as inventory management, shrink and feed utilization that also can be utilized. By working closely with your nutritionist and management team, you can select reports that focus on the areas of the feeding program that need improvement or more attention. This can improve milk production, feed efficiency and profitability on your dairy.