Twenty-two years and two editions later, 2019’s update continues to address these two important questions. Updated benchmarks reflect the changing operating conditions of today’s dairy industry.
The 15 measures provide a range of benchmarks including production, cost control, capital efficiency, profitability, liquidity, repayment schedule, solvency, mission statement, labor force and nutrient management. All production and financial measures can be easily calculated with balance sheets, an income statement and pounds of milk sold.
It is important that a farm business calculate and review not just one but all of the measures for a comprehensive look at their farm business. Why? It is quite possible for a farm to achieve or exceed one or more of the competitive levels yet be unprofitable and unsustainable.
Benchmarks reflect performance of the top farms from the Ohio Farm Business Analysis Program, Cornell’s Dairy Farm Business Summaries and the Northeast Dairy Farm Summary published by Northeast Farm Credit. Top-performing farms generated the highest net farm income per cow. These measures are designed for farms with a primary enterprise of milk production and associated feed production.
Let’s take a look at the measures summarized in Table 1.
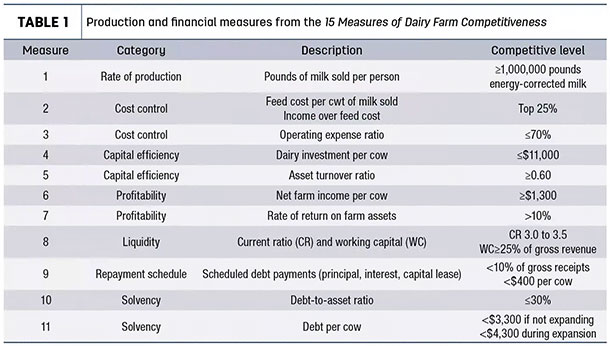
Rate of production – Milk sold per worker
The increasing cost of labor and its impact on cost of production means managers need to measure, evaluate and monitor labor efficiency. Herd productivity is also important. One of the few ways to increase income per hundredweight (cwt) is to increase component production. Benchmarking energy-corrected milk (ECM) sold per worker combines labor efficiency and dairy productivity into one indicator. Ohio uses 2,500 hours per full-time equivalent (FTE), or one person working 50 hours per day, 50 weeks per year. Milk sold should include any salable milk fed to calves, and the value of this milk is also a feed cost when calculating cost of production.
Cost control – Feed
Feed costs typically comprise at least 50% of the total cost of production. Whether measured as feed cost per cwt or income over feed costs, they can be highly variable from year to year because of market influences, crop growing conditions and which animal groups are included in the calculation. The benchmark is to be in the top 25% of farms, with a lower feed cost per cwt or higher income over feed costs. It is critical that all costs are included to make a full and reasonable comparison against benchmarks. See the 15 Measures publication for tools to calculate feed costs and suggestions for optimizing feed costs.
Cost control – Operating expense ratio
Keeping total operating expenses to less than 70% of gross farm income means that 30% or more is available to meet the other obligations of the business, including principal and interest payments, family living (for sole proprietorships) and reinvestment in the business. All of the measures require accrual adjustments – adjusting cash income and expenses to reflect all of the income and all of the expenses generated for production of milk in the year being analyzed regardless of when they were paid or received. How to make these accrual adjustments for the typical cash-based system is described in the bulletin.
Capital efficiency – Dairy investment per cow
Total dairy investment is the total market value of all dairy assets. These include all assets of the dairy enterprise and land and equipment used for feed production. This measure looks at how efficiently the money on the farm is invested. Excessive investment per cow makes generating a high return on the dollars invested difficult.
Capital efficiency – Asset turnover ratio (ATR)
The ATR measures how efficiently all farm assets generate revenue. The higher the ATR, the more efficiently assets generate revenue. This measure also helps tie production efficiency to the investment in the business. For example, a farm’s dairy investment per cow might be near the benchmark of $11,000 per cow, but if production per cow is low, their ATR will likely be low, which should trigger the farm management team to investigate and correct production issues.
Profitability – Net farm income per cow
Net farm income per cow is an excellent measure of how a dairy farm is performing. It typically represents the return to labor and management for the owner/operators. Thirteen hundred dollars per cow is typical of what the top 25% of Midwest farms achieve in times of reasonable milk and feed prices. Average typically ranges from $400 to $500 per cow.
Profitability – Rate of return on farm assets (ROA)
ROA is useful for determining what the dollars invested in your farm earned. The higher the ROA, the more profitable the farm. Return on assets also represents the opportunity cost of having your dollars invested in the dairy business as opposed to another business or investment that might generate a higher return. If ROA is consistently low or negative, how long is the management team willing to burn equity?
Liquidity – Current ratio and working capital
Liquidity is a measure of the farm’s ability to pay obligations due in the coming year from the cash on hand and assets that can easily be turned into cash or used to generate cash such as feed inventories. The current ratio benchmark has risen to 3 or more, meaning that there should be at least $3 of current assets for every $1 of current liabilities on the balance sheet. This is much higher than general agriculture recommendations, reflecting the need for cash reserves to manage through prolonged periods of low milk prices.
Another way to measure cash reserves is to compare working capital, the difference between total current assets and current liabilities, to the gross revenues of the business. This comparison allows the farm to determine if there is enough cash available for the size of the business.
Repayment schedule – Scheduled debt payment
Debt is not a bad thing but, like everything else on a competitive farm, it must be managed. While a farm may meet these benchmarks, also review in the context of overall profitability. Too many scheduled payments seriously impacts the ability of the farm to meet cash obligations and have enough left to provide desired operator income and reinvest in the business. Was the farm’s debt incurred for making improvements that enhanced profitability or to finance operating shortfalls? If the latter, what actions are being taken to increase future profitability?
Solvency – Debt-to-asset ratio
Solvency is a measure of the ability of a business to meet all debt obligations following the sale of all assets. The debt-to-asset ratio tells us how much of the business is owned by the farm’s owners and how much is owned by someone else. For instance, if a farm’s debt-to-asset ratio was our competitive level of 30%, the farm owns 70% of the farm business, and 30% is owned by the holders of the farm’s debt.
Solvency – Debt per cow
Another way of looking at the ability of a farm to meet its debt obligations is debt per cow. Debt-to-asset looks at the overall debt position of the farm; debt per cow relates to how a manager would repay the debt. As the profit center of the dairy, cows generate the money to make both the principal and interest payments. Look at both debt per cow and scheduled debt per cow to evaluate the total debt you expect a cow to service and how many dollars a cow must generate per year to cover scheduled debt payments.
The final four measures (Table 2) are not necessarily financial but are important factors contributing to the long-term success of dairy farms.
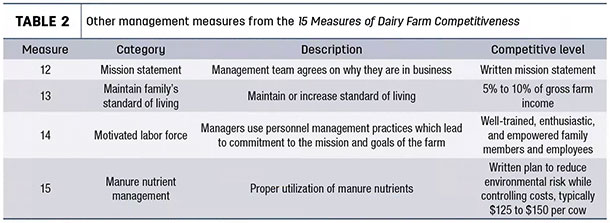
Every farm needs a mission statement; the management team and employees must know and agree on why they dairy farm and what is important to their farm business. A well-defined mission guides and focuses short and long-term decisions. Well-trained, enthusiastic and empowered employees, whether family or non-family, that understand and carry out the farm’s mission are critical to the long-term success of our dairy farms.
Download the 15 Measures of Dairy Farm Competitiveness bulletin which contains more detail of all the measures including a formula for calculation, a sample calculation and a discussion including tips for calculation, what to do and other measures to consider if your farm is not achieving the benchmark. ![]()
Dianne Shoemaker is an Extension Field Specialist, Dairy Production Economics at the Ohio State University. Email Dianne Shoemaker.