It includes 2018 income and expense averages from about 50 of our national clients’ operating results. Our usual, more comprehensive reports will be finalized in a couple of months.
Average dairy statistical data
Near the bottom of the index, the average herd size included in this study shows 2,040 and 3,145 milking cows per day for 2017 and 2018, respectively. The production of milk per cow per day shows an increase of 2 pounds per day for 2018 over 2017. Milk components are fairly consistent between the two years. A notable observation with the “herd turnover rate” shows this rate continuing to increase. The financial impact of this will be discussed below.
Milk income
The index indicates farmers’ milk price declined from $16.46 in 2017 to $15.50 in 2018. Many dairy experts will explain this decline as: “Farmers are unintended victims of the ongoing trade wars, and dairy product inventories are increasing to record highs and making exporting of these products unprofitable.”
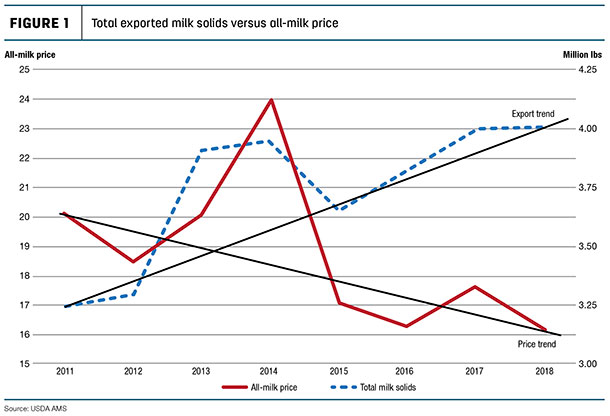
The graph “Total exported milk solids compared to dairy farmers’ all-milk price” clearly illustrates farmers’ lower milk price predicament. The graph, using USDA data, shows the trend of increased export sales and how this increasing export trend has lowered dairy farmers’ milk pay prices since 2011. Therefore it is clear, one major improvement area for declining producer pay price can generally be described as “do not produce any dairy product that cannot be profitably sold” using the producers’ perspective when saying profitably sold. In my opinion, adopting this policy today will result in substantial farmgate price increases tomorrow.
Feed expense
The overall feed costs between 2017 and 2018 reported above remained fairly consistent between the two years. Not reflected in this index was the increase in fourth-quarter feed costs that will likely continue into 2019.
Herd replacement costs
Herd replacement raising costs continue to remain high and, with feed costs continuing to increase the cost to grow self-raised heifers, this added heifer cost will likely continue to increase herd turnover cost.
A 33 percent herd turnover rate was the norm a decade ago; today we often see this turnover rate in excess of 40 percent. We see herd turnover rate increase related to an excess growing heifer population. There are simply too many self-raised heifers calving at the farm, and the excess springers cannot be profitably sold; therefore, dairies are increasing cull rates to utilize these excess replacement heifers, and this practice translates into an ever-increasing herd turnover cost.
However, dairy farms in today’s replacement heifer market buying their herd replacement springers are enjoying a record-low cost for these animals, a cost that is about $600 per head below the cost to raise them. These dairy farmers will enjoy a reduced herd turnover cost now and likely for a few more years.
Other operating costs
These dairy farm costs increased by 32 cents per hundredweight (cwt) in 2018 over 2017 and will likely continue to increase in 2019. Debt levels on farms continue to increase to cover operating losses in recent years, resulting in increased interest expense. 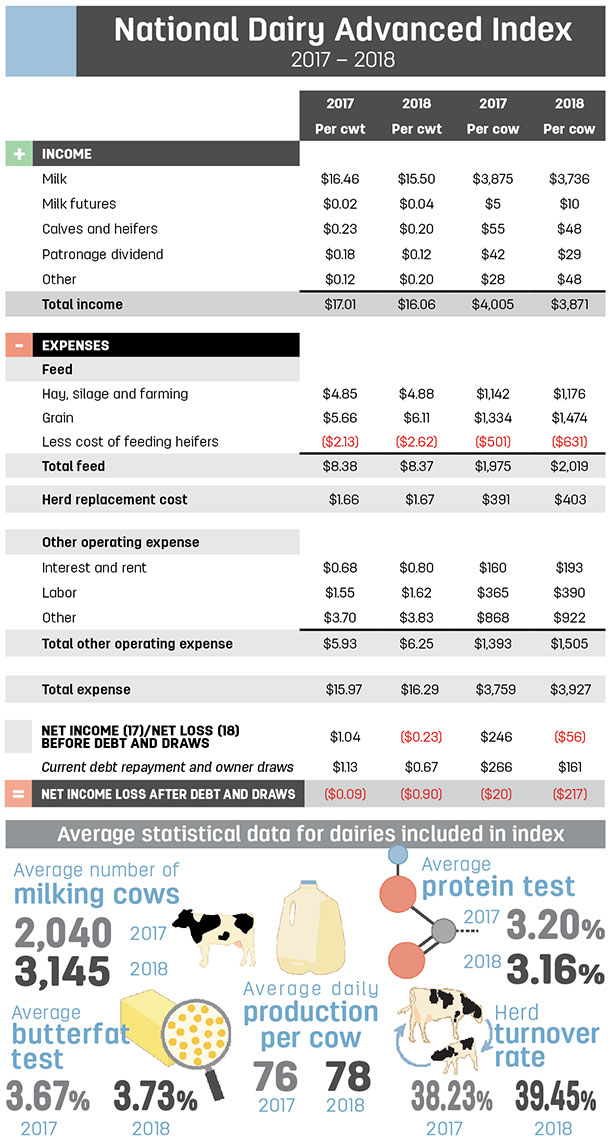
Labor is continuing to be a major farm problem, including finding employees and paying increasing farm wage rates. Labor costs will continue to increase in 2019. Other cost increases in this category are for energy and environmental, and they should continue to increase in 2019 as well.
Current debt repayment and owner draws
Cash flow needed for required debt repayment remained fairly consistent between 2017 and 2018. Within this category, there was a notable decline in owner cash withdrawals. With these continuing low farmer prices, you can continue discretionary spending (draws, capital expenditures, etc.) or feed your cows today; you don’t have the excess funds to do both.
Conclusion
The increase in net loss from 9 cents per cwt in 2017 to 90 cents per cwt in 2018 was due primarily to the reduction in the price dairy farmers received for their milk delivered into the marketplace. As implied in the milk income section previously, dairy farmers hold the key for a more sustainable milk price simply using an elementary economic principle: “Do not produce more milk than can be profitably sold.” ![]()
Gary Genske is a CPA with Genske, Mulder & Co. LLP.