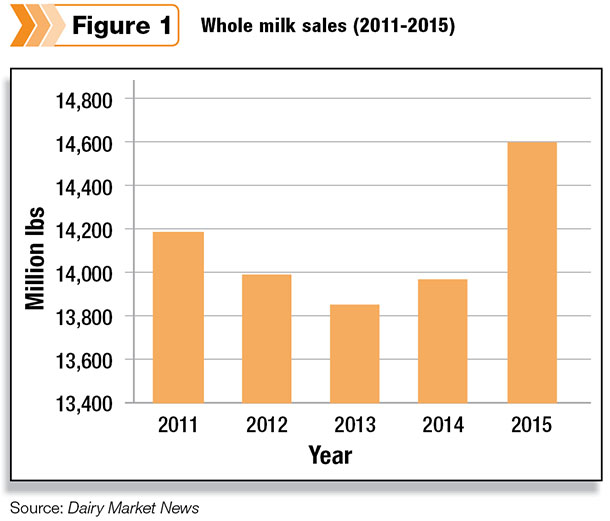
Much of the news about fluid milk focuses on its declining sales and per-capita consumption. However, there is good news to report. Whole milk sales were 4.5 percent higher in 2015 than 2014.

Almost 14.6 billion pounds of whole milk were consumed in 2015 compared to less than 14 billion pounds the prior year (Figure 1). To meet the increased whole milk demand required approximately 630 million pounds of farm milk.
On the fat side, higher whole milk sales in 2015 used an extra 20 million pounds of butterfat compared to 2014. This was 20 million pounds of butterfat that received the Class I price and not the Class IV price if used to manufacture butter.
More butterfat consumed in fluid milk is, no doubt, one of the contributing factors to relative strong butter prices, which leads to higher butterfat prices for farm milk. Without producer butterfat prices at or near record highs, farm milk prices would be even lower today.
Why is whole milk consumption increasing? Could it be the recent attention on “milkfat not being bad for our health” are changing consumers’ perceptions of whole milk? Are consumers realizing milk fat is not bad for one’s health as once led to believe? Are more consumers preferring the “whole” milk taste?
Is increased whole milk consumption due to new milk drinkers or former reduced-fat milk drinkers? Hopefully, the growth in whole milk sales will prompt market researchers to answer these questions. Answers that will help continue the upward trend.
More good news: The upward trend in whole milk sales is continuing this year. Through the first four months of 2016 compared to the same period last year, whole milk sales are up about 5 percent.
Again, this utilizes more butterfat in fluid milk and supports the butter price, which is reflected in higher butterfat prices for farm milk.
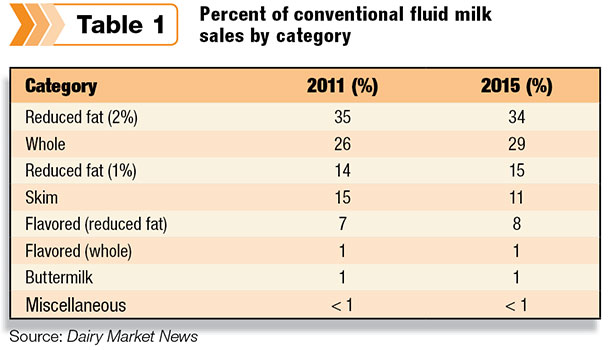
Whole milk’s share of the total conventional milk category increased from 26 percent in 2011 to 29 percent in 2015. However, reduced fat (2 percent) milk remains the leader with 34 percent of sales.
It is interesting to note that skim milk is the largest declining fluid milk category. Skim sales dropped almost 32 percent from 2011 to 2015 and only represented 11 percent of sales in 2015.
Organic
If we break whole milk sales down between conventional and organic, we see an even larger increase in sales in the organic category. Organic whole milk sales increased 60 percent from 2011 to 2015. While on organic, let me talk about organic as it relates to all dairy farmers’ milk checks.
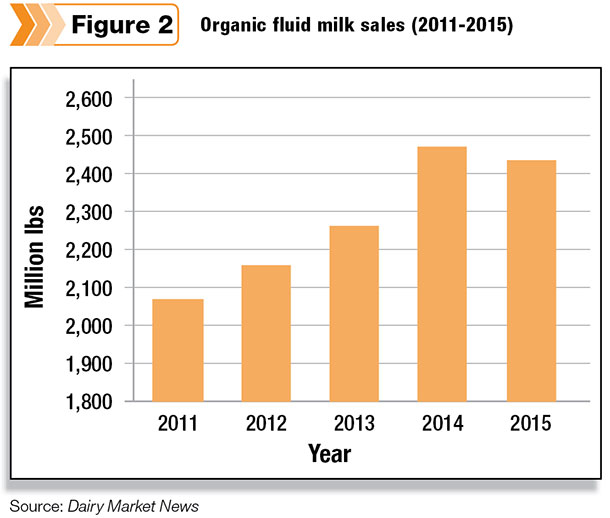
There are varying views on organic milk but, regardless of one’s view, organic milk is about 5 percent of total fluid milk sales. Organic fluid sales increased 17 percent from 2011 to 2015 (Figure 2).
Some dairy farmers may say, “How do I benefit from organic sales if I am not an organic producer?” Under regulated milk pricing systems, including federal orders, organic fluid sales contribute to the federal order producer pool – thus the blend price.
Just as conventional Class I milk lifts the blend price, the same is true with organic milk. And the pool dollars are shared by all dairy farmers in the pool, conventional as well as organic.
As shown in Figure 2, organic sales declined in 2015 compared to 2014. However, sales are recovering in 2016, with total organic fluid sales 4 percent higher during the first four months of 2016 compared to the same period in 2015.
While on organic milk, let me mention a proposed federal order amendment submitted by the Organic Trade Association. The proposed amendment would allow organic milk, which meets certain requirements, to be exempt from the federal order pool.
If the milk is not in the pool, it does not contribute to the blend price and is not shared by all producers. A number of cooperatives are on record opposing this amendment, and I agree. Allowing an exemption for milk with “special” characteristics could establish a precedent and open the door for other milk to seek the same exemption.
Such practice reduces the total dollars in the federal pool, resulting in lower blend prices to dairy farmers. Agri-Mark cooperative estimates the adoption of the organic amendment could lower annual income to dairy farmers in the Northeast about $1,500 annually.
Increased fluid sales
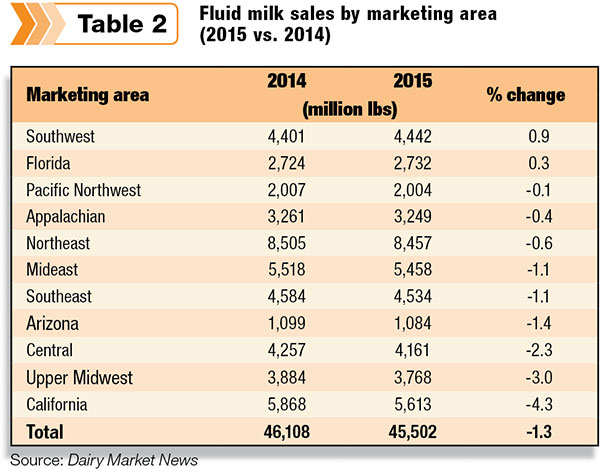
Let me share some more good news on fluid sales. Total fluid milk sales in two marketing areas, Southwest (Texas and New Mexico) and Florida, were higher in 2015 compared to 2014. As shown in Table 1, sales in these two areas were up 0.9 percent and 0.3 percent, respectively, in 2015 compared to 2014. And fluid sales in the Pacific Northwest were only down slightly in 2015.
What could be reasons for positive sales growth in Florida and the Southwest? Growing populations in both areas are likely contributing factors. Price should not be a factor in that Florida has some of the higher retail fluid prices due to the highest Class I price in the country.
Both areas have high Hispanic populations who prefer milk with higher fat content. Compared to other parts of the country, the Southwest makes extensive use of mobile dairy classrooms in its promotion efforts; could this be a factor?
 Hopefully fluid marketers can gain information from these areas as to why sales are increasing and transfer it to other areas.
It is good to finally report positive news about fluid milk. Let’s hope the trend in whole milk sales continues, and let’s be optimistic that total fluid sales will increase as well. PD
Calvin Covington is a retired dairy cooperative CEO and now does some farming, consulting, writing and public speaking.


