
It is difficult for them to understand, and rightly so, why the 2018 average all-milk price was the lowest since 2009 if milk demand outpaced supply. To try to address those concerns, we need to dig deeper into the supply and demand numbers. Plus, the digging can provide insights into future milk price direction as well.
Supply
Let’s start with milk supply. Previously in Progressive Dairyman, I have written about how dairy farmers continue to increase the total solids, mainly butterfat and protein, content of their milk production. During the past 10 years, total milk solids percentages increased from 12.45 percent in 2009 to 12.78 percent in 2018 (see Figure 1).
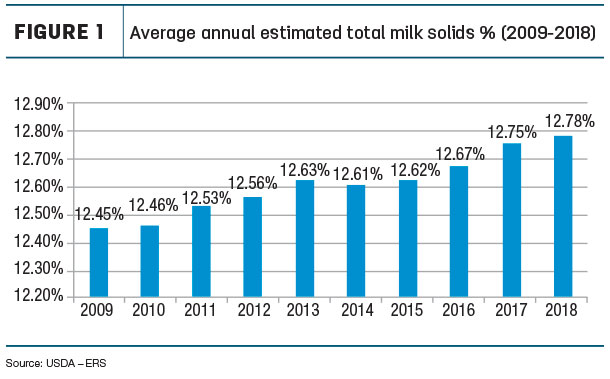
Due to higher solids percentages, the total milk solids supply in 2018 increased 1.2 percent, which is higher than the reported 1 percent increase in milk volume. Looking at the past 10 years, we see total milk volume increased 15 percent while total solids increased over 18 percent.
More milk solids results in more pounds of dairy products, be it butter, cheese or milk powder. The same volume of milk today produces more pounds of dairy products than it did 10 years ago. When the majority of the nation’s milk supply was processed for fluid consumption, monitoring changes in milk production solely by volume provided a reasonable representation. But today, about 75 percent of the nation’s milk production is utilized in some type of manufactured product, where milk solids are the key.
The bottom line: A 1 percent increase in pounds of milk means more than a 1 percent increase in pounds of products manufactured from the milk. In other words, the supply of dairy products produced was greater than 1 percent due to milk having higher solids content.
Monitoring milk supply solely on pounds of milk does not provide an accurate indication of the change in milk supply. As milk solids percentage continues to increase, it becomes even more important to use solids, not milk pounds, to gauge the true increase in milk supply. It is my hope the dairy industry would move away from talking pounds of milk entirely and focus on milk solids. The Kiwis figured this out many years ago. It is the solids in milk that give milk its economic, functional and nutritional value. Most dairy farmers are paid for their milk production based almost entirely on milk solids, not pounds of milk.
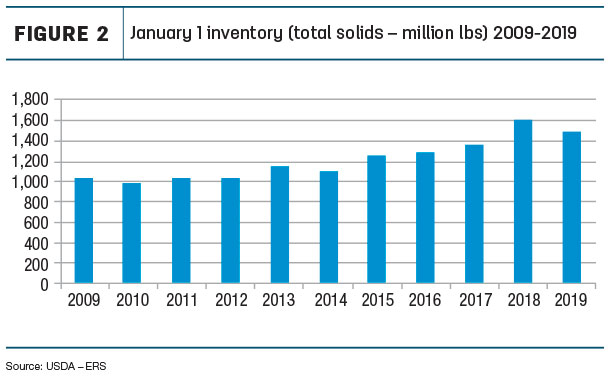
Another area to dig into regarding supply is inventory. The dairy industry began 2018 with one hand tied behind its back due to a high inventory. 2018 started with a total solids inventory over 17 percent higher than the previous year. This equates to about 76 days of milk solids production. Needless to say, this heavy inventory put downward pressure on milk prices.
The good news is: Inventories declined throughout last year. 2019 began with a solids inventory 6 percent lower than 2018. The last time the year began with a solids inventory lower than the previous year was in 2014 (see Figure 2).
Before leaving supply, let me mention another area that often comes up at dairy farmer meetings: imports. Dairy product imports have remained fairly constant, around 3 percent of domestic disappearance, for the past 10 years (see Figure 3).
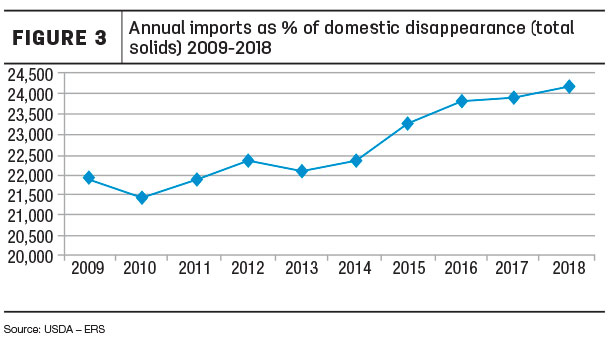
As a comparison, exports in 2018 were 15.4 percent of total disappearance. Imports did increase to 3.5 percent in 2014 when high domestic butterfat prices made imported butterfat competitive with domestic butterfat. The bulk of dairy imports are products not produced in the U.S. and have strong brand recognition. Examples are Parmigianino Reggiano and Kerrygold Irish butter.
Demand
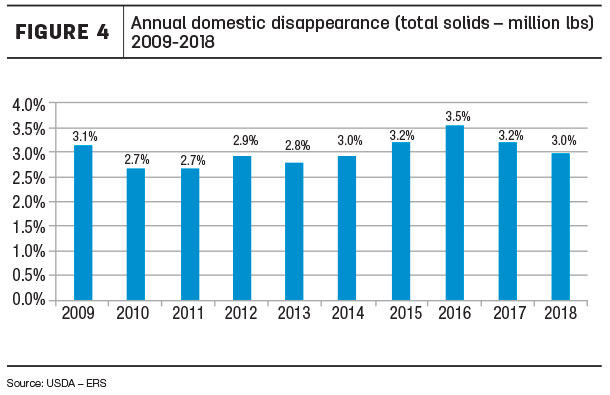
Now let’s dig into the demand numbers. As stated in the beginning, demand or commercial disappearance (total solids) was 2.3 percent higher in 2018 compared to 2017. Separating domestic and export numbers, we see exports were responsible for most of the demand increase in 2018.
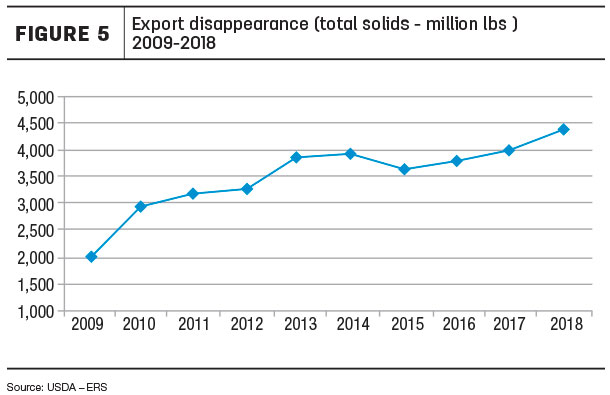
Domestic demand increased 1 percent while exports increased a hefty 10 percent (see Figures 4 and 5).
Digging a little deeper by breaking demand down between skim and fat solids, we find 91 percent of the solids exported were skim, and only 9 percent were fat. This is expected with the bulk of dairy exports being milk powder and whey products. Sixty-seven percent of U.S. nonfat and skim milk powder, 46 percent of dry whey, 57 percent of whey protein concentrate and 74 percent of lactose production was exported in 2018.
Turning to domestic demand, the breakdown between skim and fat utilization was much different. Sixty-six percent of domestic demand was from skim solids and 34 percent was from fat. This large difference in skim-fat usage between domestic and export demand impacts the dollar returns and thus the milk price.
Looking at federal order component milk values makes this clearer. In 2018, the average federal order butterfat price was $2.5258 per pound, protein $1.6497 per pound, nonfat solids 62.04 cents per pound and other solids 14.74 cents per pound. As pointed out, most exports are skim products. The milk used to produce these products is mainly priced based on nonfat solids and other solids – low component values. This results in the export dollar return per pound of milk solids being lower compared to domestic demand, with 34 percent of its solids priced on the highest component value – butterfat.
Not taking anything away from increasing export demand, exports are needed to utilize this country’s growing milk supply. But due to exports being primarily skim products, when skim values are low and especially low compared to butterfat, the relative contribution to the milk price is not as great.
On the average, a pound of milk solids exported in 2018 returned less than an average pound of milk solids sold domestically – another reason for low milk prices in 2018 even when demand exceeded supply. As with inventories, there is good news to report for this year. The February nonfat solids price is over 80 cents per pound. Exports are providing a higher return in the milk check compared to last year.
One more area to dig into, which impacts the milk check, is declining fluid milk sales. Depending upon the area of the country, the fluid or Class I milk price is from $1.60 to $6 per hundredweight (cwt) higher than the advanced Class III or IV price. In other words, a pound of milk solids consumed as fluid milk returns more dollars than a pound of solids utilized for manufacturing.
In 2018, it is estimated about 1 billion fewer pounds of milk were utilized in fluid compared to 2017. Thanks to the continuing growth in demand of manufactured dairy products, lost fluid sales were replaced by manufactured products. However, this was a billion pounds of milk from which dairy farmers did not receive the additional $1.60 to $6 per cwt. Again, another reason why milk prices were low, even though dairy demand exceeded supply. Under classified milk pricing, the type of dairy products sold impacts the farmer’s milk check.
Summary
In summary, if milk demand exceeded milk supply in 2018, why did the milk price decline? The solids percentage in milk increased; 2018 began with historically high inventories; exports were responsible for most of the demand increase, but an average pound of exported milk solids returned less than a pound of domestic milk solids; and declining fluid milk sales, about a billion pounds of milk moving from a higher to a lower milk class. There is positive news for 2019, which should help improve milk prices. The year began with inventories lower than 2018, and the nonfat solids price is increasing. ![]()
Calvin Covington is a retired dairy cooperative CEO and now does some farming, consulting, writing and public speaking.

-
Calvin Covington
- Retired Dairy Co-op Executive
- Email Calvin Covington