As a dairy business consultant, I’m frequently asked two questions:
- With components contributing most of the pay price, and the high cost of trucking and marketing milk, should I be focusing more on components and less on volume?
- We are good at enhancing butterfat and protein tests by manipulating the lysine-to-methionine ratios in the diets, but does it pay to do so when milk prices are low?
Both are good questions that deserve scrutiny.
The current market situation is marked by record-high cheese prices and a wide range in Class III and Class IV milk prices. We don’t know how long this is going to last. So let’s start by studying how Northeast dairy farmers were paid for milk over a full year in 2019.
Even in more “normal” times, 2019 was certainly a wild ride in terms of a farm’s milk check (Table 1).
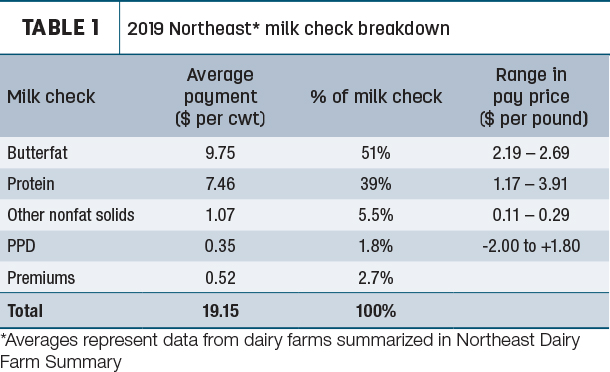
There were large swings in component pay prices, drastic changes in producer price differentials (PPDs) and continued higher shipping and marketing expenses in our Northeast Dairy Farm Summary (NDFS).
Table 1 provides a breakdown of the average milk payment (on a per-hundredweight basis) for dairy farms participating in the NDFS. 2019 was a record-breaking year in that component income was 95.5% of the average farm’s pay price. Much of that story was in the wide range for protein and PPDs. Protein prices averaged $2.38 per pound, but the range was very wide. A 0.01 improvement in protein resulted in a 12-cent-per-hundredweight (cwt) increase in the milk price early in the year, rising to 39¢ per cwt late in the year.
The spread in the butterfat pay price was tighter, ranging from $2.19 to $2.69 per pound and averaging $2.50 per pound during 2019. Each 0.01 improvement in butterfat test resulted in a 22- to 27-cent-per-cwt increase in the 2019 milk price.
Premiums paid to producers continued to erode in 2019, falling to 52 cents per cwt. Premiums include any premium paid by the milk handler including volume, milk quality or other.
PPDs averaged 35 cents per cwt in 2019, but the bigger issue was the variation: PPDs ranged from $1.80 per cwt in the beginning of the year to almost -$2 per cwt in the fall.
Expenses examined
On the expense side of the milk check, it was also a record-breaking year for trucking and marketing costs and balancing fees in the Northeast. At an average of $1.22 per cwt combined, these were higher than PPDs and premiums combined.
There will be one big change in your farm’s milk check in 2020: Protein will overtake butterfat in terms of the top income source. Based on current forecasts for 2020, butterfat is expected to average $1.91 per pound, while protein is expected to average $3.24 per pound.
Does the fact that most of our milk pay price comes from components mean I should be focusing more on test and less on milk volume?
You would think that with components being 95% of milk income, shipping extra water is not a benefit, but we need to follow the income over feed cost (IOFC) formula to answer that question. Here is the problem with thinking that milk volume is not important: Milk volume is the carrier of the components and is linked in the pay price formula. Every additional pound of milk a cow makes comes with butterfat, protein and other nonfat solids (ONFS) income, along with premiums and PPD. Generally, the trucking and marketing costs negate the PPD and premiums income. In 2019, that net income (after marketing and trucking) amounted to 18 cents per pound for each additional pound of milk. Therefore, milk volume can’t be ignored.
We also shouldn’t ignore component test because that is how we maximize component pounds shipped, but we need to make sure we are getting a return on the money spent to enhance component test – especially when component prices are lower. We know that if we enhance butterfat or protein test, we realize a higher pay price for our milk. How much of an increase depends on the pay prices for butterfat and protein.
For example: If the herd is making 80 pounds of milk per day, and the butterfat pay price is $2 per pound, each 0.01 improvement in the fat test adds 20 cents per cwt to the milk price. In this example herd, that adds 16 cents per cow per day. We need to make sure we spend less than 16 cents per cow per day to gain that fat test to get a strong return on investment (ROI).
While I’ll accept a 50% ROI, my ideal ROI target for feed additives to raise components is 100%. For example, spending 10 cents per cow per day should return 20 cents per cow in milk revenue per day.
I have always felt that a strong return is needed on inputs like this because of the many biological and operational factors impacting a dairy farm. One example is that there can be a week or two lag time between investing in a ration change involving components and seeing the result. That is a source of shrink that needs to be figured into the ROI. Another issue is the effect of summer heat on component performance. The other potential issue is shrink and loss that can happen on farms with feed and feed ingredients. The feed additive that costs 10 cents per cow can quickly become 11 cents when we have spillage, refusals or storage losses.
The point is: We can’t afford to spend 20 cents per cow in ration additives and get back just 20 cents. This may look like breakeven economics, but with so many biological and operational factors, it’s really a loss. We need to keep our purchased feed cost per pound of component as low as possible without sacrificing milk volume.
A new measure to track on farms is purchased feed cost per pound of component (feed cost per cow per day divided by pounds of fat and protein combined). For example, if feed costs are $5.50 per cow per day, and cows produce an average of 6 pounds of fat and protein per day, the feed cost is 92 cents per pound of components. Based on 2019 benchmarks in NDFS herds, a good feed cost goal is equal to or less than 88 cents per pound of component.
I have developed a milk revenue calculator spreadsheet that helps us plug in current milk check pay prices and marketing expenses and quantify the impact that a potential change in milk produced or fat and protein test could have on your farm’s milk revenue per cow per day (Figure 1).
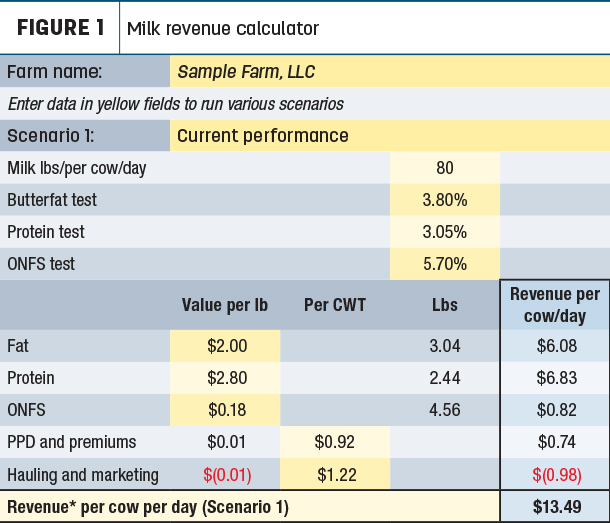
By changing the milk pounds or butterfat or protein test up or down, the spreadsheet can be used to model the impact a ration change may have on your milk revenue per cow per day. What I have learned using this spreadsheet is the importance of milk volume for maintaining milk revenue and the relationship between milk and protein test to milk volume. Using 2019 pay prices, you could gain a point of butterfat or protein and lose a pound of milk and still maintain the same milk revenue per cow per day.
Alternatively, gaining a pound of milk and losing a point of fat or protein (not both) keeps your milk revenue level. Note: If there is any additional feed cost to this scenario, you have gone backward in IOFC. If there is a feed savings, IOFC has improved.
When component prices are low, should my feeding strategy change?
Milk price is based on the underlying values of the components. The basic concept is that when component values rise, so does the milk price. Subsequently, when milk price is dropping, so are the underlying component pay prices. When component prices are lower, the potential ROI is much lower.
- Butterfat: Nutritionists tell me that when butterfat is above $2 per pound, it’s likely they can get a return on feeding palm fats to enhance butterfat test. When the butterfat pay price is at $2.50 per pound, it’s very likely they can show a good return on feeding palm fats. This year looks like we need to be careful with additive costs to boost butterfat to get a good ROI. Note that butterfat price is expected to dip well below $2 per pound many months during the year and was under the $1.40-per-pound range in April and May.
- Protein: Nutritionists tell me that additives to enhance protein can be more costly (bypass protein is more costly than rumen-degradable sources, so it tends to add more overall cost to the ration), and it takes a minimum protein pay price of $2.50 per pound or more for the additives to be likely to produce a decent return. When protein prices get over $3 per pound, nutritionists tell me it’s very likely to give a ROI. With protein paying an average of $3.24 per pound, it looks like there is a chance to get a good ROI with protein most months.
One of the big challenges some producers are facing is a mandatory reduction in milk volume, with low prices paid on excess milk. These farms must reduce production below the target or be as efficient as possible with all feed inputs because the excess milk is priced well below cost of production.
Conclusion: My feeding strategy advice
- Target your lowest purchased feed cost per pound of component sold and highest income over purchased feed costs (IOPFC). Focusing on just milk volume or component test can hurt you in IOPFC.
- Use forage to your advantage to help lower purchased feed costs.
- Know what your net cost of the butterfat and protein additives are in the rations.
- Use net costs after offsetting other feed ingredients.
- Check ROI periodically on your component additives, especially during periods of heat stress.
- Monitor component pay prices regularly, and be especially watchful for a two- to three-month low in the cycles. When component prices dip for more than a month at a time, this is where you want to pull back on additional component additive costs until prices climb back into the targeted range for ROI.
- Don’t be afraid to sit down with your nutritionist and model ration changes to see if you can improve IOPFC. If something looks promising, make the change and give it enough time to take effect.
Email Mark Mapstone if you would like to get a copy of the milk revenue spreadsheet.