However, benchmarking costs with others in the industry is the most popular use for them. We also produce this same report for the top 25 percent of our dairy clients. Starting in 2017, we started producing the quarterly National Dairy Financial Index. The purpose of this report is to get a feel for how the U.S. dairy industry is trending. We produce this report quarterly and strive to get these out within 75 days of the quarter’s end. This index includes about 50 dairies from 13 different states, and these 50 dairies are the same ones used for each index.
This article will focus on the comparative information for two different periods – the 9 months between Dec. 31, 2018, versus Sept. 30, 2019, of which I will comment on (Table 1), and the 12 months of Sept. 30, 2018, versus Sept. 30, 2019, which is provided for your viewing (Table 2).
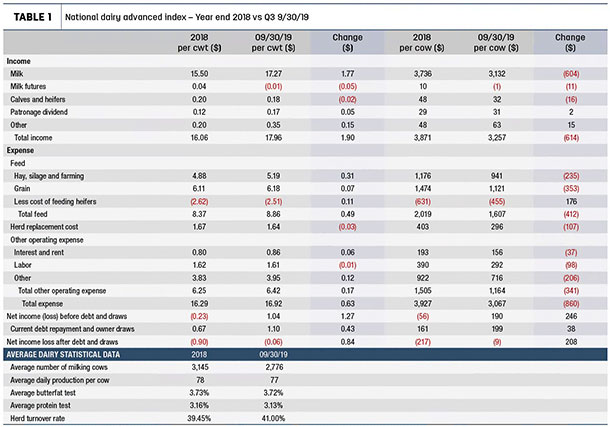
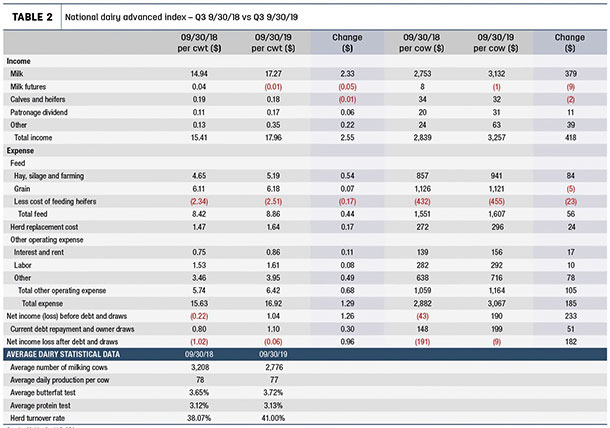
Average dairy statistical data
The average number of milking cows were 3,145 and 2,776, respectively. The average daily production per cow, average butterfat test, average protein test and turnover rate were all relatively the same. Since November 2018, which is when California went into the federal order, I have noticed that many of my California dairy clients are paying more attention to their protein test. They are compensated much more for this component than under the state-based order. In addition, Jersey herds have also seen their milk checks increased by approximately 70 cents per hundredweight (cwt) for this same reason.
Income
A dairy owner’s milk price increased from $15.50 per cwt in 2018 to $17.27 in 2019, or $1.77 per cwt. This, along with the recent Phase One trade agreement with China, has added optimism in 2019 as well as 2020. The producer price differential (PPD) is a little different from region to region, and I looked at only the High Plains area. PPD decreased by only 2 cents per cwt and with milk plants depooling. I actually expected this to be a larger decrease.
Feed expense:
Overall feed cost increased 49 cents per cwt. Most of the increase came from higher prices for hay and silage, particularly in the West. Looking at the current futures board, it seems 2020 feed prices will remain consistent with 2019.
Herd replacement cost
Herd replacement cost remained consistent. The area of concern going forward is: Many dairies have more heifers than are needed to support their cull rates. In most cases, it costs more to raise a heifer than what she can be sold for. This paradigm shift is causing dairies to take a closer look at the number it takes to support a desired cull rate and to not raise more than is needed. The unintended result of fewer heifers might help stabilize milk supply in the future.
Other operating expenses
These expenses increased by 17 cents per cwt and will likely continue to go higher moving forward. Interest rates spiked up during the middle of 2019 and came back down in September 2019. At the same time, debt levels have increased to cover operating losses from 2018. Everyone’s debt levels vary, but a 1% increase in the interest rate will add about 7 cents per cwt to costs. Though not an issue this period, labor is a major farm problem. Finding motivated and qualified employees, along with paying increased wage rates, will continue to be an issue.
Current debt repayment and owner draws
Cash flow needed to cover owner draws and principal repayment increased 43 cents per cwt. I have seen a fair number of bankers now require higher principal repayment in relation to prior years. In addition, owner cash withdrawals also increased.
Conclusion
The decrease in net loss from 90 cents to 6 cents per cwt or 84 cents per cwt was due primarily to milk price. As you can see there was still a 6-cent-per-cwt loss for the period ended September 30, 2019. However, there is optimism going forward. Class III prices for 2020 as of this writing are $1.50 higher than through Sept. 30, 2019. Will PPD increase or decrease? Your guess is as good as mine. ![]()
Albert Nunes is a CPA and partner with Genske, Mulder & Co. Email Albert Nunes.