Do you know what you’re missing by not lowering your somatic cell count? The University of Kentucky and Southeast Quality Milk Initiative (SQMI) launched an online dashboard in 2014 to help producers determine those opportunity costs. Dr. Jeffrey Bewley, a UK associate professor and extension dairy specialist, provides details about the dashboard below.
Q. What is the web address?
http://afsdairy.ca.uky.edu/MilkQualityCalculator
Q. What is it?
BEWLEY: This UK/SQMI Milk Quality Economic Opportunity Dashboard calculates the economic opportunities for increased revenues through increased milk quality bonuses and increased milk production associated with lowering SCC.
Q. Why was it developed?
BEWLEY: We noticed that many dairy producers underestimate the missed economic opportunities associated with lowering SCC. The milk quality bonus is more tangible because producers see it on the milk check. However, the lost milk production associated with not lowering SCC is much more difficult to see. The total value of lowering SCC is surprising to most people. The overall goal of the tool is to motivate changes toward lower SCC. This decision tool is the first of many to be developed as part of the SQMI program, which is a USDA-funded, multi-state project focused on improving milk quality in the southeastern U.S. and across the world. Check out our website for additional information and future tools.
Q. Who should use it?
BEWLEY: Dairy producers looking to increase dairy revenues and dairy industry advisors working with these producers.
Q. Is there a cost to use it?
BEWLEY: No, the tool is free to use for anyone with access to the internet.
Q. What are some unique features?
BEWLEY: The tool is very simple to use. The goal is for the individual farmer to enter their farm-specific situation for only six inputs.
Q. How does it work?
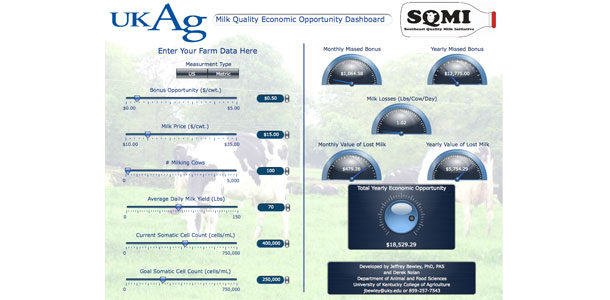
BEWLEY: On the left side of the dashboard, a producer can enter their farm-specific situation. This task can be accomplished either by moving the slider along the line under the input name, entering the exact number into the blue circle to the right of the line or using the up/down arrows beside the blue circle to change the input. First, enter the bonus (dollars per hundredweight) that you would receive with a lower SCC. For example, if you are not receiving a bonus at all but could receive a 50-cent bonus if you lowered your SCC to less than 300,000, you would select 50 cents. Or if you are receiving a bonus of 50 cents but could receive an additional 25 cents by lowering your SCC to another threshold, you would select 25 cents.
Next, you enter a current milk price, your average milking herd size and your average yearly production level (pounds per cow per day). Finally, enter your current somatic cell count along with a realistic goal for lowered SCC. For example, you may currently have a SCC of 600,000, and your interest is in lowering SCC to 300,000. On the right side of the dashboard, the monthly and annual value of missed quality bonuses, the daily per cow losses in milk production, the monthly and annual value of lost milk production, and the total yearly economic opportunity (lost bonus and lost milk production that would be observed with a higher SCC). It is really quite amazing how quickly these numbers add up.
Q. Why is this important to understand or utilize?
BEWLEY: Improving milk quality is beneficial for dairy consumers, cows and farmers. This tool helps demonstrate economic opportunities for lowering SCC.
Q. What feedback have you heard from dairy producers?
BEWLEY: Dairy producers have liked the simple, dynamic output and ease of use. PD

Jeffrey Bewley
Associate Professor
University of Kentucky


