
Therefore, it is important for all of us involved with the dairy industry to know what consumers are telling us about dairy products. What products are consumers drinking or eating more of, and which dairy products are they demanding less?
Let’s start with total dairy consumption (see Figure 1). Per-capita consumption of all dairy products increased over 10 pounds from 2000 to 2017 (total solids milk equivalent).
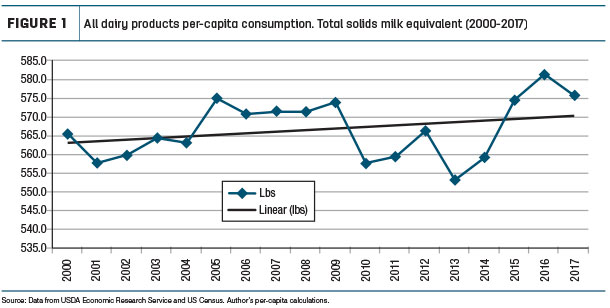
When we consider the U.S. population adding over 40 million people during the same time period, the gain is even more impressive.
The trend line for per-capita consumption is slightly upward. Unfortunately, per-capita consumption moved down in 2017 after increasing for three consecutive years. Preliminary data indicates consumption is remaining flat or slightly down in 2018. Declining per-capita consumption is one reason for relatively low farm milk prices. Plus, it shows the need to continue to increase exports to offset the domestic decline.
Now let’s take a look at individual dairy products starting with cheese, which utilizes over 50 percent of the nation’s milk supply. For nine consecutive years, per-capita consumption of natural cheese increased, reaching 36.9 pounds in 2017 (Table 1).
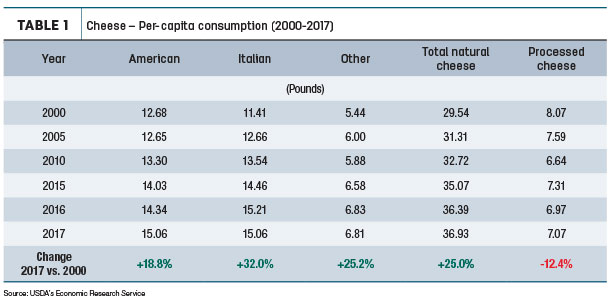
This is a 25 percent increase since 2000. If cheese consumption and population continue to increase at modest rates, it will require another 3.2 billion pounds of cheese to meet cheese demand by 2030, which equates to about an additional 32 billion pounds of milk.
Two items stand out in Table 1. After surpassing American cheese consumption in 2005, Italian cheese consumption moved steadily upward until 2017, when it declined. The decline in Italian cheese consumption is mainly due to lower mozzarella consumption, the major pizza cheese. The bombardment of pizza advertisements and discount coupons is an indicator of sales challenges in the pizza business.
The second item is processed cheese – think American cheese slices. Per-capita consumption is a pound lower in 2017 versus 2000. Barrel cheese is a major ingredient in processed cheese. Linking demand to price, the October 2018 CME barrel cheese price was the lowest monthly October barrel price since 2006, an indicator of lower demand.
It is obvious more and more consumers are “eating” their milk compared to “drinking” their milk. This is evidenced by growing cheese consumption and shrinking fluid milk consumption. Per-capita consumption of fluid milk was only 149 pounds in 2017 (see Table 2).
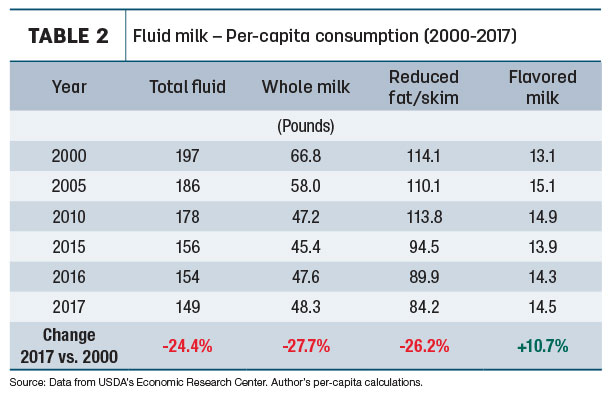
In the early 1950s, fluid consumption was about 300 pounds per capita. 2017 was the second-largest year-to-year percentage consumption decline in recent years. If the current rate of decline were to continue, per-capita fluid consumption would be below 100 pounds in 2030. And fluid milk would utilize less than 15 percent of the nation’s milk supply.
A bit of positive news for fluid milk is whole milk. 2017 was the third consecutive year per-capita consumption of whole milk increased. Data so far in 2018 points to this trend continuing. More good news: The trend for flavored milk consumption is slightly up. However, increases in both whole and flavored are not enough to offset the large decline in reduced fat and skim milk consumption.
Dairy farmers receive a triple whammy from declining fluid sales. First is the overall loss in sales and markets for farm milk. Fluid milk plants continue to close, which eliminates milk markets for dairy farmers. Second is a lower overall milk price. The fluid or Class I milk price is at least $1.60 to $6 per hundredweight (cwt) higher than the Class III or IV price, manufacturing milk prices.
Less Class I milk lowers federal order blend prices. Third is increased difficulty in meeting federal order pooling requirement. Pooling milk requires associating with a plant that has fluid milk sales. As fluid sales decline, this makes pooling more difficult.
To end our look at what consumers are telling us, we turn to butter, yogurt and ice cream (see Table 3). Since 2000, butter consumption is up over a pound per capita.
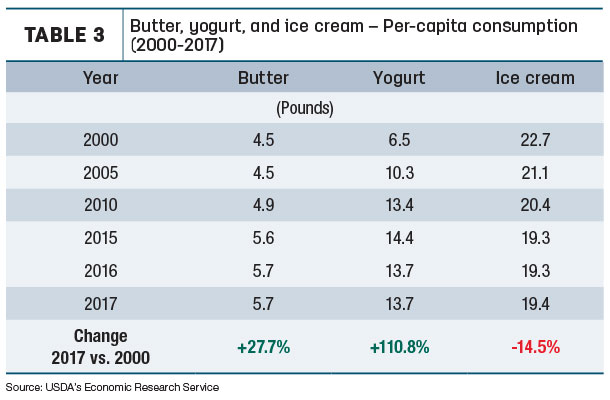
Granted, current butter consumption is still about one-third less than it was before World War II, but an additional pound is significant. This is a primary reason for strong butterfat prices over the past few years. Butter consumption appears to have stabilized over the past three years; let’s hope it starts moving upward again.
As seen in Table 3, yogurt consumption doubled since 2000 but has leveled off over the past two years. Why? Let me provide an explanation. For many years, yogurt was sold in 8-ounce packages and was not strained such as Greek style yogurt. Today, the biggest yogurt seller is Greek, and it generally comes in a 5.3-ounce package. More yogurt units may be sold, but there is less volume per unit.
Plus, Greek yogurt is thicker, and its protein content is about double that of conventional yogurt. Less has to be consumed to get the same or more nutrition and appetite satisfaction as conventional. What per-capita yogurt data fails to show, depending upon the processing method used is: Greek yogurt may require twice the milk volume as conventional yogurt to make the same pounds of finished product. The result is: Strained or Greek yogurt varieties utilize more milk production.
Ice cream per-capita consumption is over 3 pounds less in 2017 compared to 2000. Like yogurt, consumption has stabilized over the past three years. Similar to yogurt, a smaller package size could be impacting consumption. Today, much ice cream is sold in 1.5-quart versus one-half-gallon packages. Unit sales may be the same or higher, but total volume is lower due to a smaller unit size.
In summary, what are our consumers telling us? Per-capita domestic consumption of all dairy products has steadily increased for many years, but it declined in 2017, and 2018 appears to be another down year. Cheese continues to be the driver of the dairy industry. Consumption continues to increase, and each year a larger share of the country’s milk supply is manufactured into cheese. To keep up with increasing consumer demand will require an expansion of current and building of new cheese factories to handle the growing demand.
Even though fluid milk may be one of the best, easiest-produced and most economical sources of nutrition, consumers continue to drink less milk every year. The fluid milk segment of the dairy industry is in the danger zone. It appears consumers are no longer resistant to milkfat, evidenced by higher consumption of whole milk and butter. There should be more ways to capitalize on this trend and utilize more milkfat. We need to continually watch what our customers are telling us by the dairy products they purchase and respond accordingly. ![]()

-
Calvin Covington
- Retired Dairy Co-op Executive
- Email Calvin Covington


